Install the Monitoring service
The Monitoring service allows you to gather metrics from Collibra Data Governance Center. The service also provides extensive monitoring and diagnostics capabilities.
For an on-premises Jobserver in combination with a Collibra Data Governance Center environment, it is optional to install an on-premises Monitoring service.
Tip For the installation on Linux without root permissions, also read the services section.
Steps
Use this drop-down to select your operating system:
Note Anti-virus and/or security software may block the installation on Windows. Make sure that these allow the installation of software and services.
For more information, see also the Collibra University course.
- Run the installer:
-
Linux as user with sudo rights:
sudo ./dgc-linux-5.7.10-0.sh
Linux as root user:./dgc-linux-5.7.10-0.sh - Linux as standard user:
./dgc-linux-5.7.10-0.sh - Windows Server: double-click setup.bat
Important The path of the installer file cannot contain spaces.
If you run the installation without Administrator rights, an error is shown.
Tip If you don't want to use the user interface even if it's available, add the following to the command:
-- --nox11 -
Linux as user with sudo rights:
- In the wizard introduction, click Next.
- Enter the Installation directory of the Monitoring service.
- Default location on Linux as root or user with sudo privileges: /opt/collibra
- Default location on Linux as standard user: ~/collibra
- Default location on Windows Server: C:\collibra
Important On Windows, the target installation directory cannot contain spaces.
- Click Next.
- Enter the location of the Collibra Data Directory.
- Default location on Linux as root or user with sudo privileges: /opt/collibra_data
- Default location on Linux as standard user: ~/collibra_data
- Default location on Windows Server: C:\collibra_data
Important On Windows, that target data directory cannot contain spaces.
- Click Next.
- Clear all components except Monitoring.
- Click Next.
- Enter the port of the service. The default port is 4407.
If you run multiple environments on one node, this port must be unique for each environment. - Click Next.
- Enter the Agent service settings and click Next.
Setting
Description
Agent port The TCP port that is used by Collibra Console to manage the services of an environment.
The default port is 4401.If you run multiple agents on one node, this port must be unique for each agent.
Node address The hostname of the node on which the Agent service is running.
You cannot use a loopback address if you want to use the node in a multinode environment.
Warning Do not use the loopback address.
- Click Install.
The installation of the Monitoring service starts. - On Windows, you may see User Account Control warnings requesting to make changes to your device.
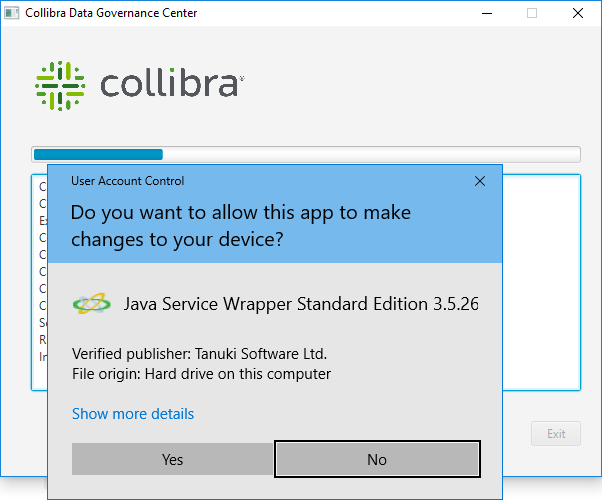
Click Yes for each of the requests, if you click No, the installation will fail. - Click Exit.
The Monitoring service is installed on your node.
What's next?
Add the Monitoring service to your environment in Collibra Console.